Use a data matrix to create revenue insights
Revenue leaders today have access to a wealth of data that their predecessors could only have dreamed of - call recordings, contract terms, intent data and product usage.
And yet very few are harnessing the information that their go to market teams are generating.
Here is a simple workshop for revenue leaders to run, with support from their ops team, to start deriving ideas around how data could inform your decision making.
Who to include?
This is a workshop style activity so three things to consider
Get people in a room. You want your team’s ideas flowing, and that happens best when people come together, with whiteboards, Post-it notes and pens.
Include colleagues from across Marketing, Sales and Customer Success. This is about connecting dots across siloes so we need every revenue function’s voice heard.
Keep it strategic not technical. This is about what you will do with the data, not how you will technically access it or do the analysis. Focus on leaders and a handful of team members that know which systems are in use.
Draw the matrix
On a big whiteboard draw out the matrix below.
We are going to look at data across two dimensions:
Marketing, Sales and Customer Success - as a buyer interacts with each of these teams what data do we capture?
1st, 2nd and 3rd Party - how is this data split across different sources?
What’s the difference between 1st, 2nd and 3rd party data?
1st party - data we generate ourselves in our own systems - like a seller entering data into the CRM, or a customer’s usage of our product.
2nd party - data we exchange with our partners - perhaps we co-sponsor an event and they share the attendees with us.
3rd party - data we buy in from other providers - advertising data, review platforms or economic data.
Lay out all possible data on the matrix
Give everyone a pack of Post-it notes, a pen and 20 minutes.
Throw every possible type of data up on the wall in the appropriate box.
There are no wrong answers. Some sources may appear in multiple boxes.
Don’t worry about whether this data actually exists or is accessible.
At the end of this exercise you should have something like this graphic here.
Connect the dots
After a break, bring the team back together and we’re going to start to look for connections that could inform our decision making.
This is why we need senior leaders and strategic thinkers in the room. We are not trying to find out how we would technically connect the dots - but imagining what insight we might be able to derive if we could.
Consider these ideas:
If someone initially finds our company through a Product Review platform - does that have an impact on the amount they negotiate from our standard contracts?
If our sales team talk through customer stories in their calls, does that make it more likely that the new customer will provide a testimonial in the first 90 days?
If a customer activates a specific module in our product, does that make them less likely to be searching competitors in the second half of their contract period?
Depending on your customer segment and if your product usage is affected by weather, public events or the state of the economy you might have more elaborate hypotheses that might inform your strategy.
Once again, take 20 minutes to allow every attendee to write down their ideas on a Post-It note and ask them to stick it underneath the main matrix.
(Doing this as a workshop activity rather than open discussion ensures the loudest and most senior voices don’t dominate)
Prioritise and plan
For the final part of the workshop we can open into discussion and talk through the potential insights that have been shared.
The ones you will likely find most powerful are the ones that cross functional roles:
Data from marketing that could support sales
Data from sales that can assist customer success
Customer success data that informs marketing activity
It is this kind of insight that is only possible through a Revenue Operations strategy - crossing functional borders and breaking down data siloes that exist with separate Marketing, Sales and Customer Ops teams.
Create a prioritised list of no more than three, and this can be the start of your data journey.
Your ops teams, or single RevOps team can now get to work on the technical aspects of sourcing this data, having it centralised in a tool like Snowflake or Databricks, and visualising it for you in a tool like Tableau or PowerBI.
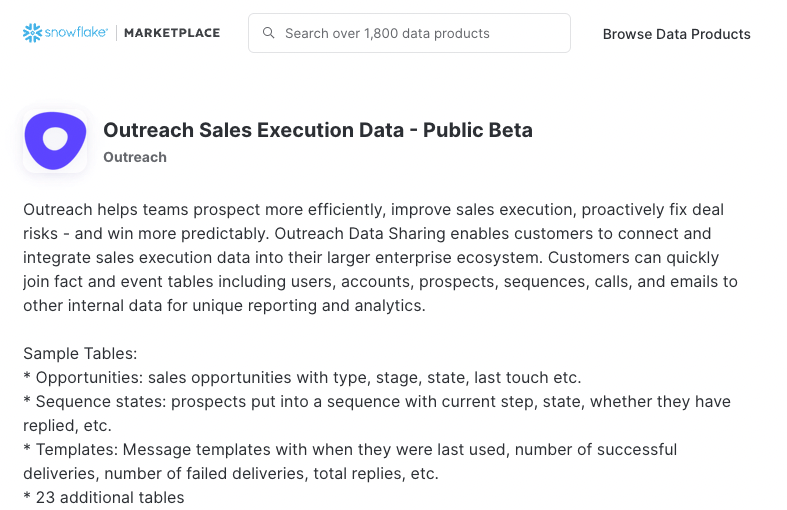
You should note that through tools like Snowflake Marketplace much of your 1st party data such as Gong call recordings or Outreach messaging can be directly available without any additional ETL processes.
So there you have it - a simple 90-minute workshop that will inform your revenue data strategy.
If you want help facilitating it - contact me through the button at the top of the page.
Get started
Whenever you are ready, there are two ways that I can help you accelerate your revenue.
Buyer Experience Audit - I’ll impersonate a buyer researching your segment and company and let you know what I find. Ideal for planning your RevOps strategy.
RevOps Impact Playbooks - I’ll help you implement one or more tactical processes across your revenue teams - content, referrals, testimonials, adoption and more.

